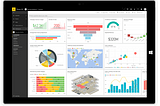
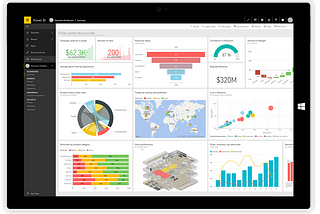
Janvi AjudiyaCreate your own dashboard using PowerBI and its reportWhat are Dashboards?Nov 10, 2021Nov 10, 2021
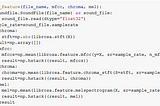
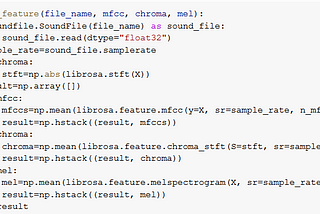
Janvi AjudiyaData Science Mini Project - Speech emotion recognitionSpeech emotion recognition, the best ever in python. The best example of it can be seen at call centers. If you ever noticed, call centers…Oct 28, 2021Oct 28, 2021
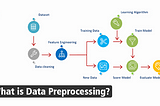
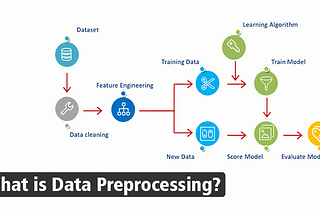
Janvi AjudiyaData Pre-processing with Data reduction techniques in PythonData Reduction: Since data mining is a technique that is used to handle huge amount of data. While working with huge volume of data…Oct 26, 2021Oct 26, 2021
Janvi AjudiyaIntroduction to PowerBI and Get started with PowerBI, Prepare data for analysis and Model data in…Power BIOct 20, 2021Oct 20, 2021
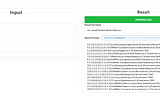
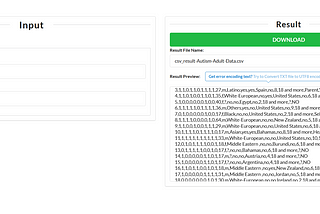
Janvi AjudiyaData Science 👩💻 | Data Preprocessing with Orange ToolThis blog is about the data preprocessing using the Orange tool. Visit the profile for previous blogs. In this blog I will be discuss about…Sep 19, 2021Sep 19, 2021
Janvi AjudiyaData Science 👩💻 | Visual Programming with Orange ToolIn this blog we will discuss about more features of Orange Tool. To learn basic of Orange Tool then see my previous blog named Getting…Sep 19, 2021Sep 19, 2021
Janvi AjudiyaData Science 👩💻 | Getting started with Neo4j and Gephi ToolNeo4j ToolSep 19, 2021Sep 19, 2021
Janvi AjudiyaData Science 👩💻 | Getting Started with Orange ToolThis blog is about Orange tool,which is a tool used in the data science.In this blog I will discuss about basic of Orange Tool and its…Sep 19, 2021Sep 19, 2021